Quantifying the difference between
recent and average precipitation
This page quantifies the magnitude of the 2025 precipitation anomaly by comparing the 2025 summer (June–August) precipitation in Gunsan and Gangneung, using Korea Meteorological Administration (KMA) observational data, with the climatological mean and the most recent 10 years (2015–2024). Additionally, the frequency and proportion of torrential rainfall events during the most recent 10 summers are calculated using maximum hourly precipitation, and the relative position of the 2025 event within this distribution is assessed.
Contents
1. 2025 Summer Precipitation vs. 10-Year Average and Climatological Normal: Gangneung & Gunsan
2. Quantifying the Precipitation Ratio
between Gunsan and Gangneung in 2025
3. Analysis of Squall Frequency and Ratios: Last 10 Years vs. 2025
4. Conclusion & Suggestion
1. 2025 Summer Precipitation vs. 10-Year Average and Climatological Normal: Gangneung & Gunsan

Comparison of 2025 June–August Precipitation in Gangneung with the 10-Year Average (2015–2024)
Gangneung's precipitation in 2025 was recorded at (187.9)mm, marking its lowest historical value. This figure clearly indicates a significant anomaly when compared to the average of the last decade.

Comparison of Gangneung's June–August Precipitation in 2025 with the Climatological Normal (1991–2020)
The previous record low for summer precipitation, set in 2010, was 298.6mm. This comparison highlights the severity of the 2025 anomalous precipitation.

Comparison of 2025 June–August Precipitation in Gunsan with the 10-Year Average (2015–2024)

Comparison of Gunsan's June–August Precipitation in 2025 with the Climatological Normal (1991–2020)
Gunsan’s summer precipitation in 2025 totaled 625.7mm, representing 91.2% of the 30-year average (686mm) and 95.2% of the recent 10-year average (656.85mm). This level did not show any statistically significant anomaly.
2. Quantifying the Precipitation Ratio
between Gunsan and Gangneung in 2025


Comparison of Precipitation Deviation Magnitude Between the Two Regions (Gunsan/Gangneung) in 2025 and the Last Decade
The 10-year average deviation value between the two regions is 1.08. The deviation value for 2025 was 3.3, recording the highest level within the 10-year period.

Comparison of Deviation Magnitude Between the Two Regions (Gunsan/Gangneung) against the Climatological Normal
The average deviation value for the Climatological Normal is 1.14, and the maximum deviation during this period was 2.93, recorded in the summer of 2000. The 2025 deviation value of 3.3 marked the highest record compared to both the recent 10-year average and the Climatological Normal.
3. Analysis of Squall Frequency and Ratios: Last 10 Years vs. 2025
Before analyzing statistical trends, we refer to the Korea Meteorological Administration (KMA)'s criteria for heavy rain:
Heavy Rain Advisory: Rain 60mm (3 hrs) or 110mm (12 hrs)
Heavy Rain Warning: Rain 90mm (3 hrs) or 180mm (12 hrs)
Terms like Torrential Rainfall and Localized Heavy Rain are descriptive terms for high intensity rainfall over a short time or specific area.
For this analysis, Torrential Rainfall is defined as hourly precipitation exceeding 20mm.
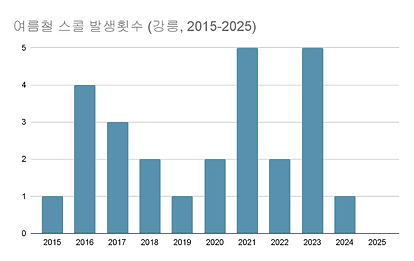
Frequency of Squall Occurrences
(Gangneung, June-August 2015-2025)

Ratio of Squall Occurrence Days to Total Rainfall Days
(Gangneung, June–August 2015–2025)
Gangneung recorded zero torrential rainfall events (0% squall ratio) in the summer of 2025, indicating a complete failure of atmospheric convection over the region. This marks a significant deviation from the 10-year average, which shows 2.6 squall occurrences and a 6.85% squall occurrence ratio.

Frequency of Squall Occurrences
(Gunsan, June-August 2015-2025)

Ratio of Squall Occurrence Days to Total Rainfall Days
(Gunsan, June–August 2015–2025)
The 10-year average for the frequency of squall occurrences is 9 times, and the 10-year average for the squall occurrence rate is 26.24%. The frequency of squall occurrences in 2025 is 9 times, and the squall occurrence rate is 36%. It can be confirmed that the frequency of localized heavy rainfall exceeding 20mm per hour in Gunsan in 2025 is 12% higher compared to the last decade.
< Conclusion and Suggestions >

The graph illustrating the squall occurrence ratio between the two regions visually represents the extreme East-West disparity in Korean peninsula's summer weather in 2025.
While 'Korean-style squalls' occurred as normal in the west (Gunsan), the development of this specific 'Korean-style squall' precipitation system was suppressed in the east (Gangneung) in 2025.
This factor was key in maximizing the total precipitation deviation between the two regions.
This page established the necessity of analyzing, using existing precipitation data, the atmospheric dynamic factors that prevented the development of Korean-style squalls in Gangneung in 2025, while simultaneously allowing them to develop in Gunsan.
Page(2) and (3) will analyze how topographical factors and large-scale circulation patterns influenced the squall development system.